Skip to content
  • Home
  • Solutions
    • Tune – Strategic Management
    • Belt – Risk Management
    • Lift – Performance Management
    • Score – Bonus
    • Grid – Budget Matrix
    • Dayway – Digital Checklist
  • Customer services: Improve your client experience
    • Data Consulting
    • Integrations
    • Trainings
  • Knowledge
    • Blog
    • Ebooks
    • Infographics
    • Events and Webinars
    • Strategy & Performance Master Series
  • Community
  • Contact us
Contact us
  • pt_BR
  • es_ES
  • en_US
  • pt_BR
  • es_ES
  • en_US

Home » Blog Actio Software » What Is the Best Graphic for Your Data Analysis?

What Is the Best Graphic for Your Data Analysis?

What is the best graph to present performance indicators and your goals?
  • 06/08/2013
  • 22:57
  • Performance Management
velocímetro

What is the best graph to present performance indicators and your goals? Today, with the use of spreadsheets, it is easy to create an infinite number of graphs to present the desired data, but not all of them are suitable for the type of information you want to convey.

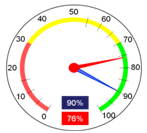
The use of the “speedometer” became widespread with BI’s (business intelligence) who took the term “Cockpit” in English literally, which means a pilot’s dashboard. While the metaphor of “running a business” can be useful, indicators where data is compiled periodically (usually monthly) are not ideal. It is best applied to discrete point measurements, such as car speed or wind speed.

To present the indicators, Stratec's Strategic Management software works with bar and line graphs, where the color of the bar (normally the one performed) is compatible with the status of each month (red, yellow, green or blue). This type of graph, copied below, has several advantages over the “speedometer” graph illustrated above. Among the advantages we can mention:

  • Trend visualization since all previous periods are displayed and not just the current status;
  • Identification of seasonality in the target, which is especially important when there are targets for gradual improvement throughout the year, or expected seasonal performance for a given indicator;
  • Possibility of comparison with the achievements of previous years, targets for the following years and benchmarks;
  • Avoids distortions in performance analysis due to the choice of measurement unit. In the graph above, the presentation is significantly different if we use the “Market Share” indicator or the “Increase in Market Share” indicator, since the measurement of both would have the same purpose.

Software Gestão estratégica

Share this content:

Picture of Actio

Actio

Share this content:

Latest posts:

Gestão Estratégica: Como alinhar metas e resultados

02/04/2025

O papel do mapa estratégico no Balanced Scorecard

02/04/2025

Gestão estratégica e planejamento: Dicas práticas

19/03/2025

Gestão de pessoas: exemplos, objetivos e como aplicar

13/02/2025

Gestão de pessoas nas empresas: Estratégias para engajar 

06/02/2025

Leave a reply

Automate, centralize, and track your company’s management processes. We combine technology with the latest in management practices.
Linkedin-in Facebook-f Instagram

CONTACT

  • [email protected]

Opening

  • Monday to Friday, 9am to 6pm

Solutions

  • Tune – Strategic Management
  • Belt – Risk Management
  • Lift – Performance Management
  • Score - Variable Remuneration
  • Grid – Budget Matrix
  • Dayway – Digital Checklist

Knowledge

  • Blog
  • Ebooks
  • Infographics
  • Events and Webinars

Actio

  • About us
  • Contact us
  • Privacy Policy
  • Terms of Service

© Actio Software. All rights reserved.

We are using cookies to give you the best experience on our website.

You can find out more about which cookies we are using or switch them off in .

Scroll to Top
Powered by  GDPR Cookie Compliance
Privacy Overview

This website uses cookies so that we can provide you with the best user experience possible. Cookie information is stored in your browser and performs functions such as recognising you when you return to our website and helping our team to understand which sections of the website you find most interesting and useful.

Strictly Necessary Cookies

Strictly Necessary Cookie should be enabled at all times so that we can save your preferences for cookie settings.

If you disable this cookie, we will not be able to save your preferences. This means that every time you visit this website you will need to enable or disable cookies again.